By Justin Kaufenberg, Managing Director at Rally Ventures and Co-Founder and Former CEO of SportsEngine.
In a SaaS+ model, the majority of a company’s revenue comes from non SaaS sources — like payment processing fees, screenings, insurance, lending, certifications, etc — as opposed to the monthly SaaS fee. As your business shifts to include usage-based revenue, you must adjust how you track and report financial metrics.
Each of the below nine categories have different requirements for SaaS+. These metrics are crucial for your CFO and financial team to understand. These metrics also help investors, team members, customers and other stakeholders understand the power of a SaaS+ business model, which, when implemented correctly, can drive customer ARR up by 5x-10x.
NRR / Cohort performance
In a SaaS+ business, it’s common to see Net Revenue Retention (NRR) exceed 150%. SaaS+ platforms capture both traditional software spend as well as the spend on additional products and services. These SaaS+ revenue sources can easily grow to be a multiple of your SaaS revenue.
This is something that should be highlighted, but you have to show the underlying details on how you calculated your company’s NRR.
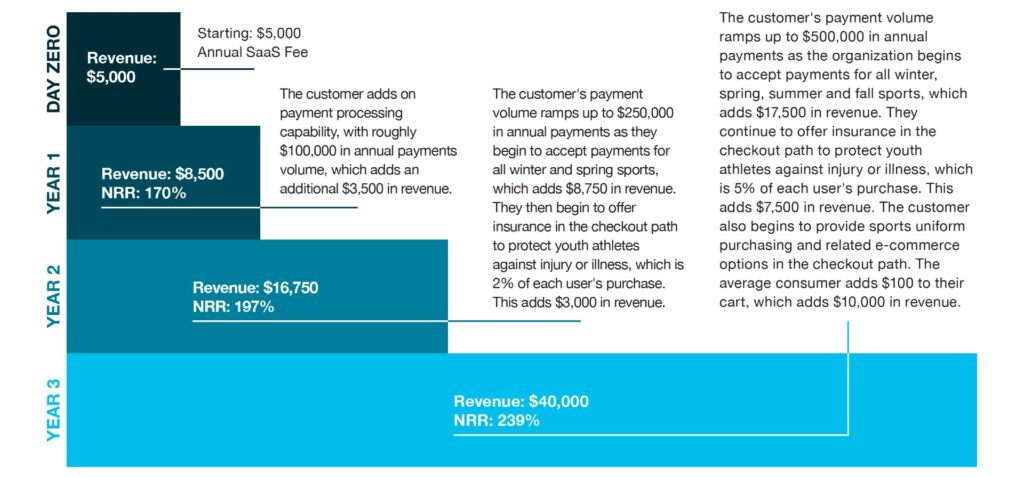
Typically, a SaaS+ customer starts with a modest SaaS fee for the core platform, then adds products like embedded payments, background screening, insurance and lending. To accurately express NRR, show both the change in the core SaaS fee and how the account value increased with these added products. As customers adopt more SaaS+ products, they often double or triple in size.
Below is an illustration of an average SportsEngine customer. In just 3 years, the customer grew from $5,000 in annual revenue to $40,000 in revenue and their ramp is only just starting with significant additional uncaptured payment volume, additional adoption of insurance and e-commerce and products #4, #5, #6 and #7 not even introduced yet. At first blush, this looked like a classic $5,000 per customer SMB market. In reality, this market is at least 10x larger than the traditional TAM analysis would suggest.
CARR / Bookings Accuracy
A key challenge in SaaS+ is accurately estimating the future value of a contract at the time of signature. Customers often overestimate their growth, and salespeople, motivated by higher commissions, may follow this optimism.
For example, if a customer believes they will process $1M in annual payments, and the company charges 3% for credit card processing, this is a $30,000 booking. However, it’s more common for the customer to process a fraction of that in the first year, which means the booking should be commensurately less.
Failing to assess the true deal size leads to inaccurate Contracted Annual Recurring Revenue (CARR). The contracts are signed, but customers are consistently processing payments and other SaaS+ add-ons below the level they anticipated.
By overestimating bookings, you’ll both pay out higher commission to your sales team and create a CARR to ARR gap, which is concerning to investors and other key stakeholders. This creates distrust around the SaaS+ model and is a distraction during fundraising. It’s better to underestimate the booking. You may want to consider adding guaranteed minimum volumes into contract language as customer truth serum.
Normalize Seasonality
Traditional SaaS businesses typically lack seasonality; a $12K ARR contract will consistently recognize $1K in monthly revenue. In contrast, SaaS+ businesses often experience some more severe seasonality. Usage-based revenue can fluctuate month to month.
This seasonality can be confusing, as it may appear that revenue is declining, but it’s often just a natural pattern. At SportsEngine, revenue consistently rose in August and September when fall and winter sports opened player registration, then dipped in October and November as teams filled up. Each industry has its nuances.
There are a few ways to show that these seasonal changes are predictable and still lead to recurring revenue.
- After the first year, you can layer year-over-year data on a graph to show consistent annual trends of revenue fluctuations.
- You can weight the months by taking historical seasonality and applying it to the current month’s revenue. For example, if revenue in June was $260,000, and based on previous years seasonality, that represented 6.3% of the total annual revenue; your seasonally adjusted ARR would be $4.1M ($260k / 6.3%).
Churn Reduction
Implementing SaaS+ across multiple products is excellent for churn reduction. When customers view your platform as essential for their business, they will generally prefer to purchase payments, insurance and other embedded products from within your platform rather than from third-party vendors.
At SportsEngine, youth sports organizations using the SaaS product alone had a 10% gross churn rate. Adding payment processing dropped gross churn to 2%, and with additional products like insurance or e-commerce, gross churn fell below 1%. Customers found it too cumbersome to switch providers once integrated with multiple products and services.
The SaaS+ companies in Rally Ventures’ portfolio experience far less churn and greater customer retention due to the added benefits beyond the core SaaS platform. Understanding and communicating this key benefit highlights the model’s power and revenue potential to stakeholders. When showing co-hort performance, be sure to display the reducing churn, right alongside the growing revenue and NRR.
Balance Sheet Management
In a traditional SaaS company, you typically only keep one simple balance sheet because 100% of the cash belongs to your business. In a SaaS+ company, some of the cash is yours and some of it just flows through your business to the customer organization.
You should maintain two separate balance sheet line items: one for your operating balance showing unrestricted cash, and another for restricted customer cash. This helps you know and show what percentage belongs to your company and what goes back to the customer. Document and report this clearly to avoid confusing investors or customers.
The best practice is to show these as two different balances and sweep profits from the customer account regularly, typically once per month, to avoid minor errors becoming big problems. An additional benefit is that banks and venture debt lenders covet the deposit volume and while you cannot use customer cash for operating purposes, you can certainly use it to negotiate a better deal with your banking partner.
Revenue Recognition on Payments
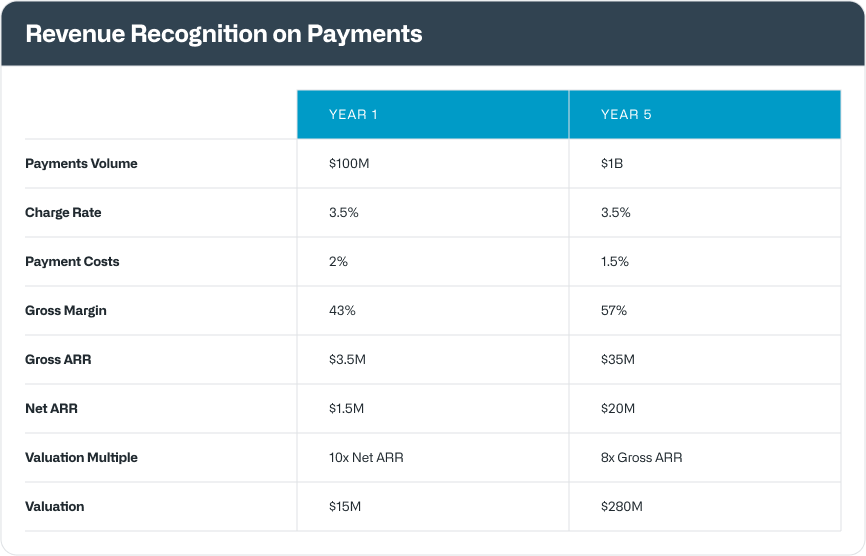
For revenue recognition on payments, typically, gross payment charges are recognized as actual revenue. For example, if you charge a 3.5% credit card processing fee on a $100 transaction, you recognize $3.50 as gross revenue. This looks like low gross margin revenue because it’s not uncommon for 2% or more of that to go to your payment processing partner. Best practice is to report both gross revenue and net revenue (the remaining amount after paying your payment processing partners).
As payment margins grow above 50%, you should gain full valuation credit for gross payments revenue. For example, with a 3.5% fee, you recognize $3.50 in recognized revenue. If processing costs are reduced to 1.5%, net revenue is 2%, resulting in a 60% gross margin on payments, which is comparable to SaaS. So now you’ll get full credit from investors on the entire gross revenue number. Possibly a slightly lower multiple of revenue, but still better than getting credit for net revenue alone.
I would suggest labeling revenue from payment processing as usage-based revenue as an overarching category, and combining it with other high-margin usage based streams like insurance and background screening. This approach can yield blended margins exceeding 50%, potentially reaching 60-80%, allowing you to get credit for the entire blended volume.
Justin explains how to think about using this model here.
Daily All Hands Internal Reports
A great benefit of having a SaaS+ business is the enormous amount of data you receive every day, as opposed to a pure SaaS business where there isn’t a lot to report on a daily basis. In a SaaS+ company, you’ll receive daily data related to payments processed, insurance policies purchased, background screenings run, etc.
This data is crucial for modeling, forecasting and adjusting as customer behaviors change. It helps you understand what is most valuable to customers and how to measure that value. Distribute this data daily in a business report showing every dollar processed, every background screening sold, each customer’s performance, etc. This is both highly motivating for the team and is necessary for salespeople paid on usage volume. I suggest a daily email to the entire staff that arrives in their inbox automatically each morning at 7am.
Sales Rep Compensation
Compensating sales reps in a SaaS+ model is complex. In a traditional SaaS model, the bulk of revenue comes from the SaaS fee, so the sales rep’s quota is completely tied to the initial sale.
However, in a SaaS+ model, most revenue comes from non-SaaS sources after the point of purchase. We recommend still tying the sales rep’s quota to the initial sale but adding compensation for activation and post-purchase spend. Sales reps should only earn commission on payment processing volume and other usage revenue once it occurs. Cash in equals commission out.
This approach aligns sales incentives with revenue generation and encourages the sales, implementation and account management teams to maximize customer spend. It also drives the next metric, the sales rep time to break even model. Properly aligning and paying commission dramatically improves this next metric.
Sales Rep Time to Break Even Model
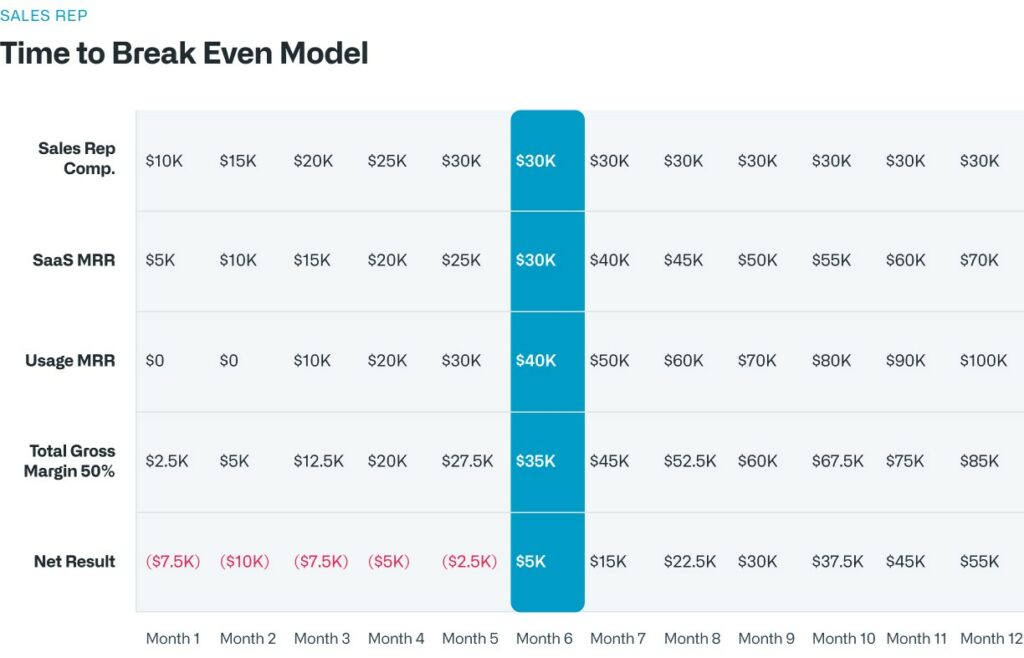
This underutilized metric is crucial for evaluating sales efficiency and deciding when to hire more sales reps. Traditional break-even models often only show a customer’s initial value, which is annualized and incomplete for a SaaS+ company.
At SportsEngine, initial contracts look small because youth sports organizations aren’t very valuable on day one. They only pay a relatively small SaaS fee, and it appears on paper as though the sales person takes forever to break even.
The contracts become much larger and more accurate when you layer in the future additive products for each customer. For example, you might land a $2K SaaS customer, but they grow into a $50K customer when you layer in the additional SaaS+ products.
The break-even model is a valuable stat to include internally and in investor decks, but it has to be a complete model inclusive of upsell.
Justin explains how to think about using this model here.
The challenge in a SaaS+ business is articulating its recurring revenue nature. Everything we’ve talked about today makes it crystal clear that usage based revenue is recurring and as good or better than SaaS, because it grows more quickly than SaaS with the ability to keep adding on additional products.